As a developer or product manager building location-aware applications in today’s world, integrating mapping functionality is almost a given. Whether you’re helping customers find your nearest store, tracking a delivery fleet, or visualizing complex spatial data, maps bring your data to life in an intuitive way.
For many, Google Maps Platform is the go-to choice, and for good reason. Its comprehensive global data, robust APIs, and user familiarity are powerful assets for enterprises. But once you’ve chosen the platform, a key decision quickly emerges: should I use a Static Map or a Dynamic Map?
This isn’t a question of which is “better.” It’s about which is the right tool for the specific job you need done on a given page or in a particular user flow. Having spent over a decade working with businesses integrating Google Maps Platform for everything from simple store locators to complex logistics dashboards, we have seen the benefits and trade-offs firsthand. Let’s break it down.
Static Maps: The Reliable Snapshot
Imagine you just need to show a picture of a map. No zooming, no panning, no clicking – just a fixed view of a specific location. That’s the essence of a Static Map.
What it is: The Maps Static API allows you to define a map using URL parameters (latitude/longitude, zoom level, size, markers, basic styling) and receive it back as a simple image file (PNG or JPG). You typically embed this image using a standard HTML tag.
Pricing: Static Maps are typically billed per request (i.e., each time the image is generated and served). This is often very cost-effective for simple, non-interactive displays.
Key Benefits:
- Simplicity: Implementation is incredibly straightforward. If you can construct a URL, you can add a Static Map. No complex JavaScript required on the client side.
- Speed: Since it’s just an image, Static Maps load very quickly, contributing to faster page render times.
- Low Overhead: Minimal client-side processing means less strain on the user’s browser or device resources.
- Broad Compatibility: Works anywhere an image can be displayed, even in environments where JavaScript is disabled or not supported (like some email clients or simple reporting tools).
- Predictable Appearance: The map looks exactly the same every time it’s loaded with the same parameters.
Limitations:
- No Interaction: This is the big one. Users cannot pan, zoom, click on anything, or change the map view in any way.
- No Real-time Data: Static maps cannot display live information like real-time traffic or the current position of a moving asset.
- Limited Complexity: While you can add markers and simple paths, displaying a large number of dynamic data points or complex overlays is not feasible.
- Basic Styling: Customization is possible but less extensive and flexible than with dynamic maps.
Ideal Use Cases for Static Maps:
- Lightweight Previews: Displaying a small, non-interactive map preview on a search results page before a user clicks through to a detail page with an interactive map.
- Historical Views: Showing a route or location from the past where real-time data and interaction aren’t relevant.
- Website Footers: “Find Us” sections showing your main office location.
- Email Confirmations: Including a map image showing a delivery address or event location in an order or appointment confirmation email.
- Reports & Documents: Embedding maps in static reports, invoices, or printable documents.
- Visual Validation: When users enter a delivery address, visual confirmation by displaying the location on a map can reduce instances of incorrect or incomplete location information, reducing costly delivery issues.
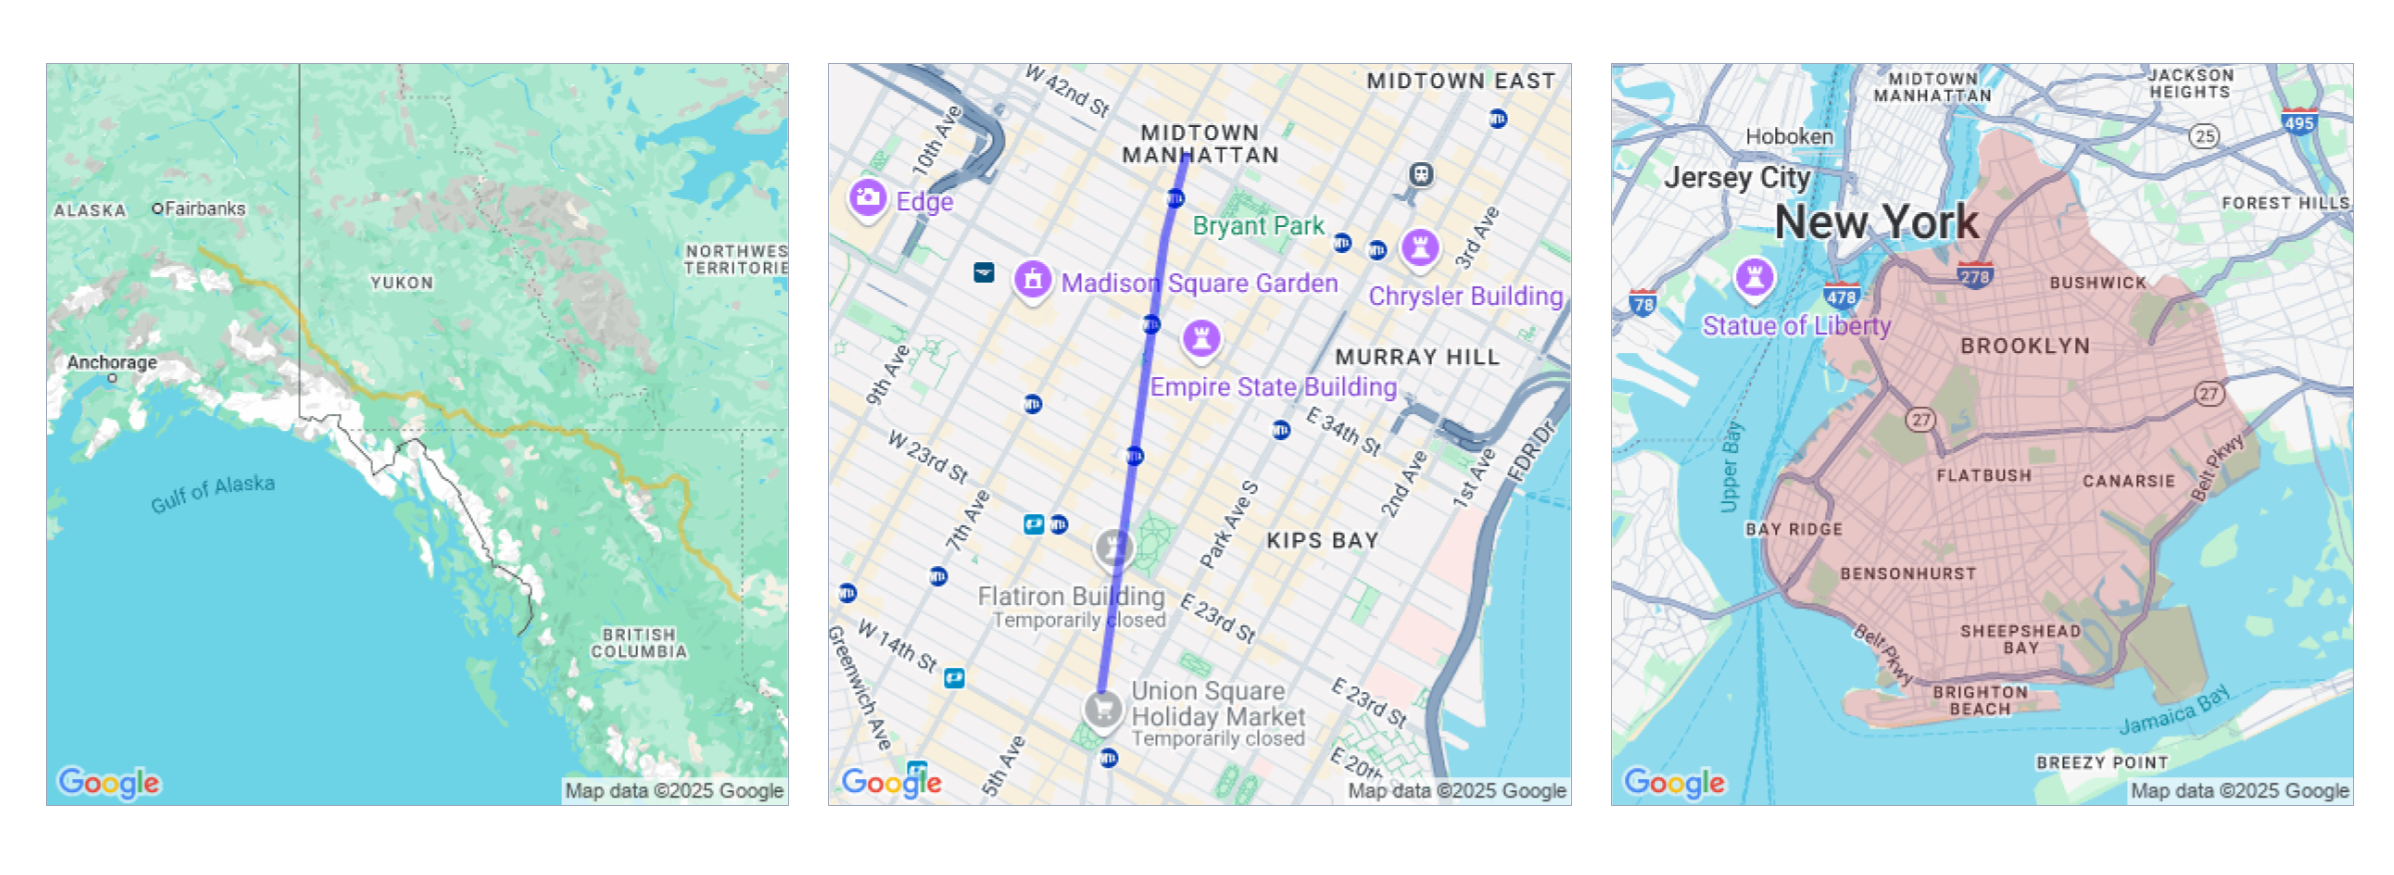
Static Map examples above pulled from 1, 2, and 3
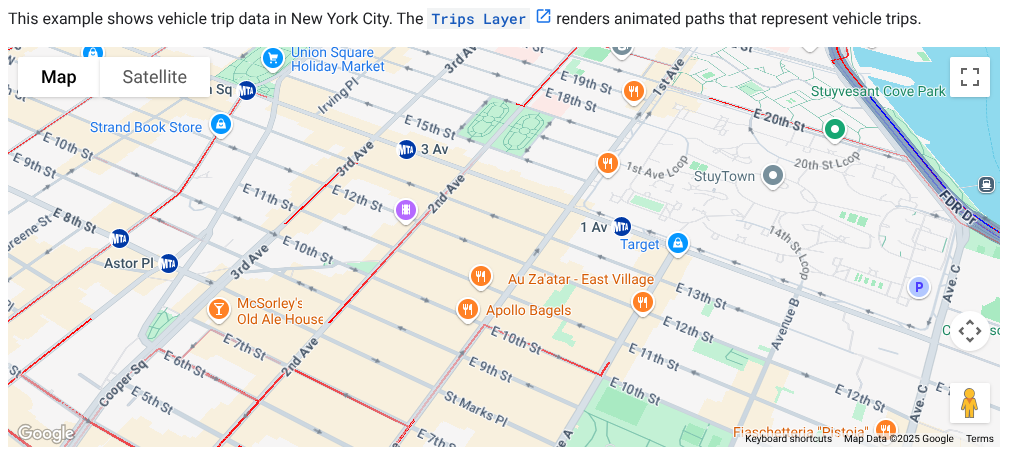
Dynamic Maps: The Interactive World
When your users need to actively engage with a map, explore different areas, or see live information, you need a Dynamic Map.
What it is: Dynamic maps are interactive map components embedded using the Maps JavaScript API for web applications or the Google Maps SDKs for Android and iOS native apps.
Pricing: Dynamic Maps are typically billed per “Map Load,” which is counted when a map instance is initialized in a web page or application screen. While seemingly higher per load than a static request, this cost model supports the interactive, session-based nature of how users engage with dynamic maps.
Key Benefits:
- Full Interactivity: Users can pan, zoom, tilt, rotate, click on markers, and interact with map features.
- Real-time Data Display: Essential for visualizing moving objects (vehicles, people) or dynamically changing conditions (traffic, weather overlays).
- Complex Visualizations: Supports displaying large numbers of markers (with clustering), drawing complex polygons (service areas, boundaries), heatmaps, and custom data layers.
- Rich Feature Set: Seamless integration with Street View, displaying rich information in info windows, drawing tools, and incorporating user input directly on the map.
- Integration Powerhouse: Designed to work fluidly with other Google Maps Platform APIs like Directions, Distance Matrix, and Places to build sophisticated location-aware workflows (e.g., displaying calculated routes, showing nearby points of interest).
- Photorealistic 3D Maps: Enhance your application with a single line of code to provide users with an interactive 3D map, giving them a more vivid and realistic understanding of locations.
Trade-offs & Complexities:
- More Complex Implementation: Requires writing JavaScript or using native SDKs, involving more code than a simple image tag.
- Client-Side Dependency: Performance can be influenced by the user’s device capabilities and browser performance. Requires JavaScript to be enabled.
- Performance Optimization Needed: For applications displaying a lot of data, careful optimization is required to maintain a smooth user experience.
Ideal Use Cases for Dynamic Maps:
- Interactive Store/Location Finders: Allowing users to search, pan, zoom, and click on store markers to see details.
- Asset Tracking & Fleet Management: Visualizing the real-time location and movement of vehicles or mobile assets.
- On-Demand Services: Displaying driver/customer locations and trip progress in ride-sharing or delivery apps.
- Routing & Navigation Visualization: Showing calculated routes, waypoints, and providing turn-by-turn visual guidance.
- Service Area Definition: Allowing administrators to draw and define operational zones or boundaries.
- Data Visualization: Overlaying business data (e.g., sales territories, customer density) on a map for analysis.
Choosing the Right Tool for the Job
So, how do you choose? Ask yourself:
- Does the user need to interact with the map? If yes, Dynamic. If no, Static might suffice.
- Do I need to display real-time or dynamically changing data? If yes, Dynamic. If no, Static.
- How complex is the data I need to show? Many points, overlays, or custom visuals lean towards Dynamic. Simple markers on a fixed view lean towards Static.
- What is the implementation environment? Webpage with JS? Email? PDF? This strongly dictates technical feasibility.
- What is the performance goal? For the absolute fastest initial render of a fixed view, Static is often better. For a smooth interactive experience with lots of data, optimized Dynamic is required.
Often, a single application will use both. A search results page might show a Static Map preview for each result, while the detail page for a selected result loads a full, interactive Dynamic Map.
Optimizing Dynamic Maps: Taming the Data Beast
For enterprise applications, especially in logistics, asset tracking, or retail networks, displaying potentially thousands or even millions of data points on a dynamic map is a common challenge. Without optimization, performance can suffer, leading to slow loading times and a choppy user experience. Here are essential strategies:
- Marker Clustering: This is a lifesaver. Instead of rendering thousands of individual markers, group nearby markers into a single cluster icon that indicates the number of points within that area. Google provides official libraries for this, making implementation relatively easy. As the user zooms in, the clusters dynamically break apart.
- Leverage Vector Maps (JavaScript API): The newer vector rendering in the Maps JavaScript API offers smoother performance, especially during zooming, panning, tilting, and rotation, compared to the older raster tile approach. It also enables more performant custom styling.
- Viewport and Zoom-Level Based Data Loading: Don’t try to load or even process all your data points on the client side at once. Implement logic to:
- Fetch only the data points whose coordinates fall within the map’s current viewport (the visible area).
- Adjust the density or type of data displayed based on the zoom level. At a high level, show regions or aggregated numbers. Zoomed in, show individual assets or locations.
- Optimize Marker Rendering:
- Use efficient image formats (WebP, optimized PNGs) for custom marker icons.
- For very high marker counts or complex custom visuals, consider advanced techniques like rendering markers directly onto a map overlay view or canvas layer for better performance than relying solely on standard marker objects.
- Efficient Event Handling: Map events like bounds_changed (fires when the map moves) or zoom_changed can fire very rapidly during user interaction. If these events trigger data fetching or UI updates, make sure to debounce or throttle your event handler functions to limit how often the code runs. This prevents overwhelming your application with too many requests or updates.
By implementing these optimizations, you can ensure your dynamic maps remain fast, responsive, and capable of visualizing large datasets effectively, providing a much better experience for your users.
Why Google Maps Platform for Enterprise Mapping Applications?
Finally, it’s worth reiterating why Google Maps Platform’s map offerings are often the preferred choice for enterprise applications:
- Unparalleled Data Quality & Global Coverage: Access to Google’s continuously updated, high-resolution, and comprehensive basemap data worldwide minimizes the need for integrating and managing disparate data sources.
- User Familiarity: The intuitive interface reduces user training and improves adoption for both internal and customer-facing applications.
- Reliability & Scale: Built on Google’s robust infrastructure, ensuring high availability and performance even under heavy load.
- Rich Feature Set: A mature and extensive set of features and styling options out-of-the-box.
- Seamless Ecosystem: Tight integration with other Google Maps Platform APIs simplifies the development of complex location-based workflows.
Conclusion
The decision between Static and Dynamic maps is a strategic one that should be guided by the specific requirements of your user experience and the type of data you need to display. Static maps offer simplicity and speed for fixed views, while Dynamic maps provide the interactive power needed for real-time data and user engagement. By understanding the trade-offs, selecting the right tool for each use case, and applying performance optimization techniques where necessary, you can build powerful, efficient, and engaging mapping solutions using Google Maps Platform.
Recent Posts
On-Demand